Thursday, May 30, 2013

Why France is F*cked

I am sure a 75% tax increase on the upper income bracket of the French people got everyone's attention. Hollande backed out of the plan and instead decided to implement the 75% tax on business with over 1 million Euros. (http://www.france24.com/en/20130524-pierre-moscovici-tax-rate-salary-cap-france)

Brillant. So let's ignore the fact that:
  • revenue generation will be minimal
  • it chases business and people (if not already) out of the country
  • this is class warfare
  • opens the door for more crazy taxes and regulations
  • creates more loopholes (lawyers, soccer players, docs are exempted)
The Keynesian Perspective

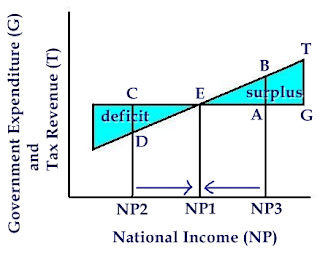
Keynesians don't even agree with Hollande's tax plan. Increase taxes during a recession goes against the logic of the Keynesian framework of something called the automatic stabilizer. The automatic stabilizer is simply defined as a way to implement tax cuts in a recession with Govt Spending flat or increased then as the country comes out of a recession you increase taxes and lower Govt spending (or flat). Then viola, you balance the budget. Nice in theory but reality is a different story (another discussion for another time).


France (and rest of Europe for that matter) are stuck in a recession.


So according to Keynesian framework there should be a tax cut there and supplement that with either an increase in or continuation of government spending. Yeah, that's not happening. Hollande has chosen to even ignore Keynes! THAT is how bad the French are dealing with their economics. 


Under the Hood


France's PMI has not crossed the 50 in over a year - major signs of contraction.


*source: http://www.businessinsider.com/french-pmi-2013-5


France's UE rate is trending upwards the last 5 years with Italy while Germany and the US trend downward. 


France is joining the PIIGs in higher yields:


EUROPEYield1 Day1 Month1 YearTime
Germany1.52%-2+30+2512:00:10
Britain
1.96%-3+28+3211:59:42
France2.10%+4+39-3811:59:58
Italy4.11%-7+22-18211:59:59
Spain4.34%-5+23-22911:59:57
Netherlands1.85%0+28+1611:59:55
Portugal5.44%+1-19-63711:59:16
Greece8.80%+23-193-210411:59:30
Switzerland0.68%-1+14+1311:58:26

* Data taken from Bloomberg


France's industrial production just sucks:


Household confidence is dismal equalling the worse confidence as seen in the previous recession


Conclusion
Move...unless you're a soccer star.


Friday, May 24, 2013

For the week ending 5/24/13

For the week ending 5/24/13:

We saw some interesting things this week with the stock market potentially showing exhaustion then bouncing off the lines of support. There were also some economic indicators that show promising signs.

Economic Indicators: All about the Jawbs...

4 Week NSA Jobless Claims, the most important observation, saw it continue downward despite the blip the a couple of weeks back.


Durable Goods showed a 3.3% jump in April over -5.9% prior and 1.7% above "forecast" by the experts at 1.6%.

Existing home sales and MBA Mortgage Index did post disappointing numbers but are not far off the consensus and the trend for the data still show good signs.

Now some % Gain/Loss tickers for the week:

S&P    -1.07%
GLD   3.02%
OIL    -2.50%
DXY  -0.63%
10YR  4.14%
RUT   -1.20%
XLF   -1.10%
XLE   -0.49%
XLU  -3.70%
XLY  -1.30%
XLP   -0.55%
XLK   -1.58%
XLB   -1.67%
XLI    -1.04%
XLV  -0.55%


Please let me know of any tickers, ETFs, indexes, or whatever you want me to put up on there. 

Thanks for reading and enjoy your long weekend,
David


Thursday, May 23, 2013

Inflation? Not with a Strong Dollar!

Here are 10 things the US has going for it:

1.) A Strong Dollar
2.) A Strong Dollar
3.) A Strong Dollar
4.) A Strong Dollar

Staring at the CPI and DXY price chart over the last 40 years paints an interesting picture. As the DXY rises the CPI drops.


So in other words when I see the DXY rolling: inflation is getting beat down. Other inflation indicators such as PCE and PPI (more of a better front runner for inflation) show a similar story:


 *Note: Data taken from St. Louis Fed, all graphs include: all items and one excluding food & energy 

As you can see from the charts above they're all heading downward in the last couple of years. That should be of no surprise. Not only do the inflation indicators point downwards but a rising dollar results in commodity deflation especially for Bernanke's Bubbles: Oil and Gold. The CRB Commodity Index over the last 10 years correlates -0.79 to the DXY. The CRB Index is down -3.04% YTD and the DXY is up 5.75% YTD. 

Next, the dollar perpetuates consumption. The US is a consumption economy with 70-73% of GDP. A higher dollar is equal to a tax cut not only at the pump but at the grocery stores and restaurants as well as energy prices are passed on to the grocery stores then on to you with higher prices for your ice cream. So why devalue the dollar? Some would argue a weaker dollar will even out our trade deficit, which is crazy unless you want to pay a larger grocery bill. I certainly dont!

Deflation is elsewhere besides at the pump and grocery stores. Check out home prices and the 30 & 15 year fixed mortgage rates. I know my mom and pop refinanced their home. They get the pay the house off quicker, which is nice because I am tired of paying rent in the basement!

More importantly, increasing mortgage rates and bond yields are rising not because of inflation signs but the TIPS are not moving with it which indicates growth not inflation.

Many people had their eyes on Bernanke and his (in)ability to wreak havoc on people's financial future. A higher CPI => lower dollar => bearish for growth => lower stocks. ECB is playing catchup as they implement rate cuts which has seen inflation (CPI #'s) decline the last couple of months.

Why the Almighty Dollar will continue:

Several Central Banks are holding the CTRL+P keys. Japan, S. Korea, Australia are in a fun little printing war. Euro is euro trash (although there are early signs of econ data improving). Many people are looking to the dollar as Bernanke and the Fed ran out of bullets in September of last year. What the hell is he going to do? Buy more bonds! Nope, he's cutting back those purchases.

The dollar spurns confidence in consumers which spurns better looking economic data. Jobless claims 4 week NSA avg is been looking great that last several months. Wanna see how much that influences the stock market? Invert the Jobless Claims and you will see it snug right up to the S&P. Like peas and carrots. Or how about the US 10 Year Yield and Jobless Claims? Housing data has already been picking up for better looking inventories, more new and old home sales, and less foreclosures. Plus, we are just underway in the home selling season.

Thanks for reading,
David